API 參考
finlab.plot
本頁內容8
finlab.plot 用 plotly 畫出 K 線、板塊圖、雷達圖、河流圖和策略圖表。每個繪圖函式都回傳 plotly.graph_objects.Figure,呼叫 .show() 就會顯示,也能再用 plotly 的方法調整。plot_candles() 接受任何價格序列、plot_tw_stock_radar() 能比較任何 FinLab 資料集;其餘的 plot_tw_stock_* 讀台股資料,只適用台股。
選哪個函式
| 你想做的事 | 用這個 |
|---|---|
| 畫台股 K 線與技術指標 | plot_tw_stock_candles() |
| 用自己給的價格畫 K 線(美股或自訂資料) | plot_candles() |
| 看全市場各產業的漲跌、成交或估值(台股) | plot_tw_stock_treemap() |
| 在板塊圖加上自己的指標 | create_treemap_data() |
| 比較幾檔股票的財務指標排名 | plot_tw_stock_radar() |
| 看股價落在本益比或股價淨值比的哪個位階(台股) | plot_tw_stock_river() |
| 看雲端策略持股的產業分布 | StrategySunburst |
| 比較雲端策略與大盤的報酬 | StrategyReturnStats |
這些圖都需要 plotly 套件(pip install plotly)。
畫 K 線與技術指標
plot_tw_stock_candles() 讀入一檔台股的開高低收與成交量,畫出 K 線、成交量、主圖上的輔助線(預設布林通道)和技術指標子圖(預設一組 KD):
from finlab.plot import plot_tw_stock_candles

# 繪製台積電最近 200 個交易日的 K 線圖
plot_tw_stock_candles(stock_id='2330', recent_days=200).show()
用 overlay_func 換主圖的輔助線、用 technical_func 換子圖,technical_func 裡每個字典是一張子圖:
from finlab.data import indicator
from finlab.plot import plot_tw_stock_candles

overlay_func = {
    'ema_5': indicator('EMA', timeperiod=5),
    'ema_10': indicator('EMA', timeperiod=10),
    'ema_20': indicator('EMA', timeperiod=20),
    'ema_60': indicator('EMA', timeperiod=60),
}
k, d = indicator('STOCH')
rsi = indicator('RSI')
technical_func = [{'K': k, 'D': d}, {'RSI': rsi}]

plot_tw_stock_candles(
    symbol='2330',
    recent_days=600,
    adjust_price=False,
    overlay_func=overlay_func,
    technical_func=technical_func,
).show()- 股票代號用字串,
stock_id是symbol的別名;recent_days是顯示最近幾天的資料。 - K 線圖顯示開盤價、最高價、最低價、收盤價。
- 回傳的
Figure可以再用fig.add_trace()加上自訂指標。
finlab.plot.plot_tw_stock_candles
plot_tw_stock_candles(symbol, recent_days, adjust_price, resample, overlay_func, technical_func) -> go.Figure繪製台股技術線圖圖組
參數
symbolstr台股股號,ex:
'2330'。recent_daysint預設400取近n個交易日資料。
adjust_pricebool預設False是否使用還原股價計算。
resamplestr預設'D'技術指標價格週期,ex:
D代表日線,W代表週線,M代表月線。overlay_funcdictK線圖輔助線,預設使用布林通道。
from finlab.data import indicator overlay_func={ 'ema_5':indicator('EMA',timeperiod=5), 'ema_10':indicator('EMA',timeperiod=10), 'ema_20':indicator('EMA',timeperiod=20), 'ema_60':indicator('EMA',timeperiod=60), }technical_funclist技術指標子圖,預設使用KD技術指標單組子圖。
設定多組技術指標:
from finlab.data import indicator

k,d = indicator('STOCH')
rsi = indicator('RSI')
technical_func = [{'K':k,'D':d},{'RSI':rsi}]
回傳
plotly.graph_objects.Figure技術線圖
範例
from finlab.plot import plot_tw_stock_candles
from finlab.data import indicator

overlay_func={
              'ema_5':indicator('EMA',timeperiod=5),
              'ema_10':indicator('EMA',timeperiod=10),
              'ema_20':indicator('EMA',timeperiod=20),
              'ema_60':indicator('EMA',timeperiod=60),
             }
k,d = indicator('STOCH')
rsi = indicator('RSI')
technical_func = [{'K':k,'D':d},{'RSI':rsi}]
plot_tw_stock_candles(symbol='2330',recent_days=600,adjust_price=False,overlay_func=overlay_func,technical_func=technical_func)
plot_candles()
用你提供的價格序列畫 K 線,plot_tw_stock_candles() 就是讀好台股價格後呼叫它,所以美股或自訂資料都能用。
from finlab import data
from finlab.plot import plot_candles

symbol = '2330'

plot_candles(
    symbol,
    close=data.get('price:收盤價')[symbol],
    open_=data.get('price:開盤價')[symbol],
    high=data.get('price:最高價')[symbol],
    low=data.get('price:最低價')[symbol],
    volume=data.get('price:成交股數')[symbol],
    recent_days=200,
).show()
from finlab import data
from finlab.plot import plot_candles
data.set_market('us')
symbol = 'AAPL'
plot_candles(
symbol,
close=data.get('price:close')[symbol],
open_=data.get('price:open')[symbol],
high=data.get('price:high')[symbol],
low=data.get('price:low')[symbol],
volume=data.get('price:volume')[symbol],
recent_days=200,
).show()| 參數 | 型別 | 預設 | 說明 |
|---|---|---|---|
symbol | str | 必填 | 顯示在標題;指標回傳 DataFrame 時,也用它挑出這檔股票的欄位。stock_id 是別名。 |
close、open_、high、low、volume | pd.Series | 必填 | 單一股票以日期為索引的價格與成交量。 |
recent_days | int | 250 | 畫最近幾列資料。 |
resample | str | 'D' | K 棒週期:'D' 日線、'W' 週線、'M' 月線。 |
overlay_func | dict 或 list[dict] | None | 主圖上的線,{名稱: 指標}。不指定時用 data.indicator('BBANDS') 的布林通道。 |
technical_func | dict 或 list[dict] | None | 技術指標子圖,每個字典一張子圖。不指定時用 data.indicator('STOCH') 的 KD。 |
回傳 plotly.graph_objects.Figure。
指標可以是 DataFrame(data.indicator() 的結果)、Series、NumPy 陣列、接收 OHLCV DataFrame 的函式,或 TA-Lib 函式名稱字串,例如 'RSI(timeperiod=14)';用函式名稱要先安裝 ta-lib。data.indicator() 預設用未還原的價格計算,所以請傳入未還原的開高低收,輔助線才會和 K 棒對齊。
看全市場的產業板塊圖
plot_tw_stock_treemap() 把台股依市場別與產業分層排成板塊,方塊大小和顏色各代表一個指標:
from finlab.plot import plot_tw_stock_treemap

# 範例 1:視覺化期間報酬率(起訖日要是交易日)
plot_tw_stock_treemap(
    start='2024-01-02',
    end='2024-01-31',
    area_ind='market_value',  # 方塊大小:市值
    item='return_ratio',  # 顏色:報酬率
).show()

# 範例 2:方塊大小改用成交金額
plot_tw_stock_treemap(
    start='2024-01-02',
    end='2024-01-31',
    area_ind='turnover',  # 方塊大小:期間成交金額(億元)
    item='return_ratio',  # 顏色:報酬率
).show()

# 範例 3:視覺化本益比分布
plot_tw_stock_treemap(
    start='2024-01-02',
    end='2024-01-31',
    area_ind='market_value',
    item='price_earning_ratio:本益比',
    clip=(0, 50),  # 限制本益比範圍 0-50
    color_continuous_scale='RdBu_r',  # 紅藍配色
).show()start和end都要是交易日。return_ratio是兩日之間的報酬率,設成同一天會全部是 0。- 用資料集當
item時,顯示的是期間內最後一筆的值。 - 資料或
area_ind拿不到時回傳None。
finlab.plot.plot_tw_stock_treemap
plot_tw_stock_treemap(start, end, area_ind, item, clip, color_continuous_scale, treemap_data) -> go.Figure | None繪製台股板塊圖資料
巢狀樹狀圖可以顯示多維度資料,將依照產業分類的台股資料絢麗顯示。
參數
startstr資料開始日,ex:
'2021-01-02'。endstr資料結束日,ex:
'2021-01-05'。area_indstr預設'market_value'決定板塊面積數值的指標。 可選擇
["market_value","turnover"],數值代表含義分別為市值、成交金額。itemstr預設'return_ratio'決定板塊顏色深淺的指標。 除了可選擇依照 start 與 end 計算的
"return_ratio"(報酬率), 亦可選擇FinLab資料庫內的指標顯示近一期資料。 example:'price_earning_ratio:本益比'- 顯示近日產業的本益比高低。'monthly_revenue:去年同月增減(%)'- 顯示近月的單月營收年增率。
cliptuple將 item 邊界外的值分配給邊界值,防止資料上限值過大或過小,造成顏色深淺變化不明顯。 ex:(0,100),將數值低高界線,設為 0~100,超過的數值。
Note
參考pandas文件更了解
pd.clip細節。color_continuous_scalestr預設'Temps'treemap_datapd.DataFrame客製化資料,格式參照
create_treemap_data()返回值。
回傳
plotly.graph_objects.Figure樹狀板塊圖
範例
ex1: 板塊面積顯示成交金額,顏色顯示'2021-07-01'~'2021-07-02'的報酬率變化,可以觀察市場資金集中的產業與漲跌強弱。
from finlab.plot import plot_tw_stock_treemap
plot_tw_stock_treemap(start= '2021-07-01',end = '2021-07-02',area_ind="turnover",item="return_ratio")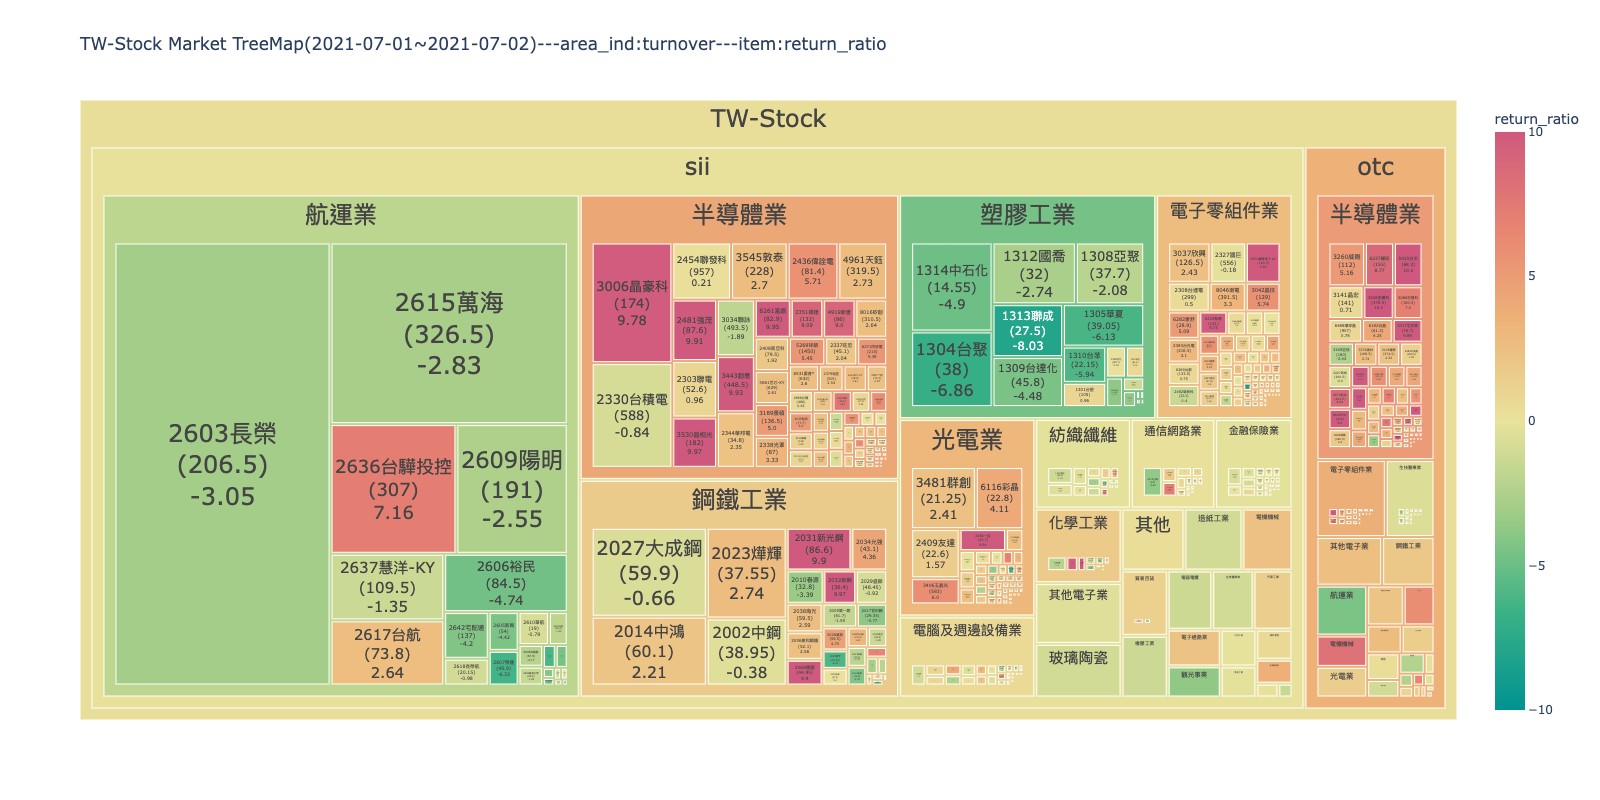 ex2:
板塊面積顯示市值(股本*收盤價),顏色顯示近期本益比,可以觀察全市場哪些是權值股?哪些產業本益比評價高?限制數值範圍在(0,50),
將過高本益比的數值壓在50,不讓顏色變化突兀,能分出高低階層即可。
from finlab.plot import plot_tw_stock_treemap
plot_tw_stock_treemap(area_ind="market_value",item="price_earning_ratio:本益比",clip=(0,50), color_continuous_scale='RdBu_r')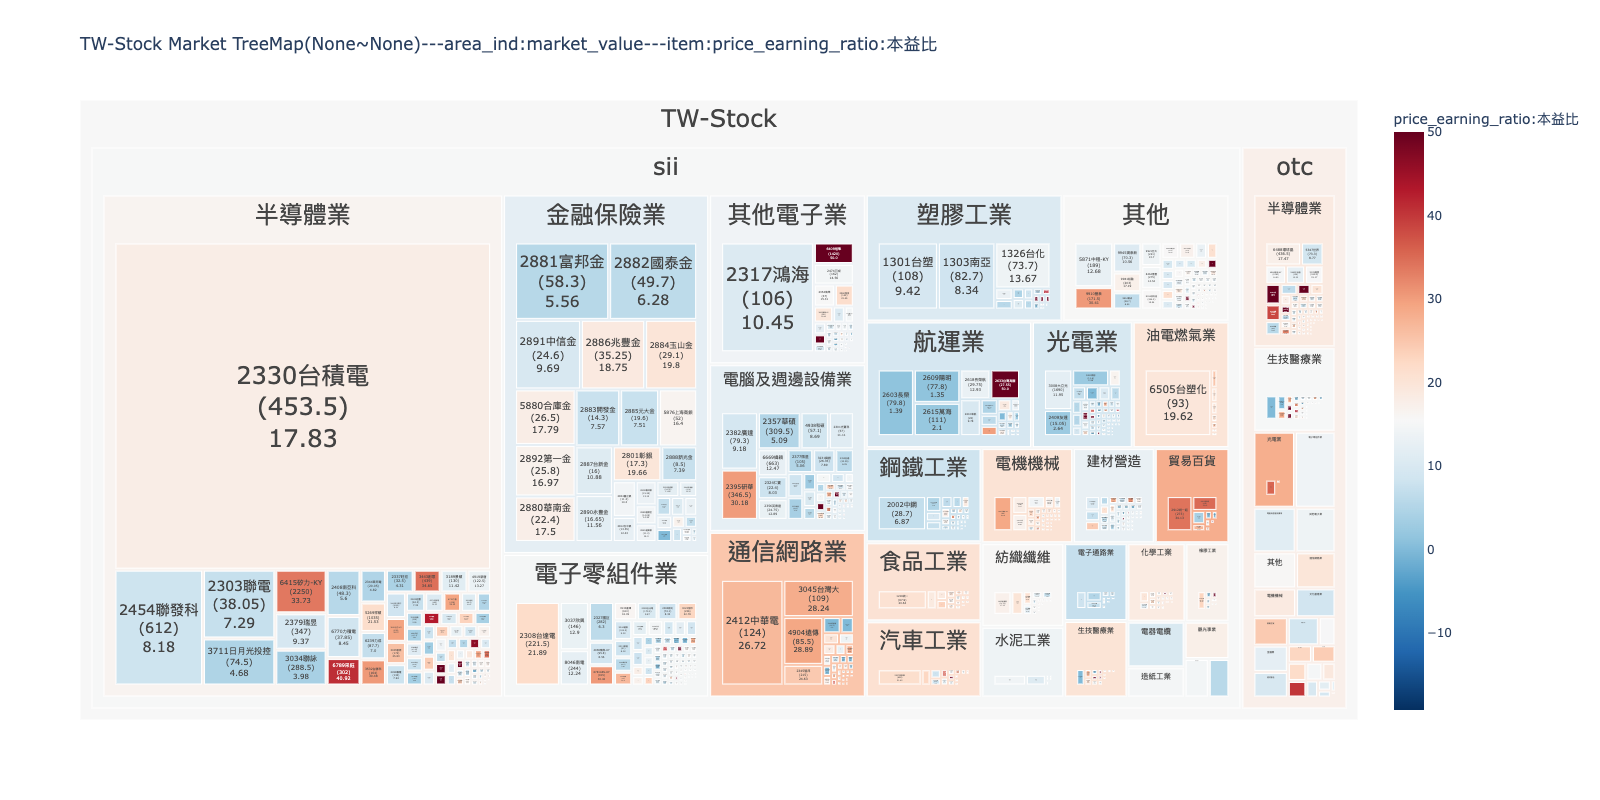
想放進資料庫以外的指標,先用 create_treemap_data() 取得板塊圖用的資料表(每檔台股一列,含 symbol、close、turnover、return_ratio、category、market、market_value、country 等欄位,item 是資料集名稱時再多一欄),加上自己的欄位後傳給 plot_tw_stock_treemap(treemap_data=...):
from finlab.plot import create_treemap_data

treemap = create_treemap_data(start='2024-01-02', end='2024-01-31', item='return_ratio')

# 可進一步處理資料或使用其他繪圖工具
print(treemap.head())
item 在期間內沒有資料時回傳 None。
finlab.plot.create_treemap_data
create_treemap_data(start, end, item, clip) -> pd.DataFrame | None產生台股板塊圖資料
產生繪製樹狀圖所用的資料,可再外加FinLab資料庫以外的指標製作客製化DataFrame,
並傳入plot_tw_stock_treemap(treemap_data=treemap_data)。
Examples
欲下載所有上市上櫃之價量歷史資料與產業分類,只需執行此函式:
from finlab.plot import create_treemap_data
create_treemap_data(start= '2021-07-01',end = '2021-07-02')| stock_id | close | turnover | category | market | market_value | return_ratio | country |
|---|---|---|---|---|---|---|---|
| 1101 | 20 | 57.85 | 水泥工業 | sii | 111 | 0.1 | TW-Stock |
| 1102 | 20 | 58.1 | 水泥工業 | sii | 111 | -0.1 | TW-Stock |
參數
startstr資料開始日,ex:
"2021-01-02"。endstr資料結束日,ex:
"2021-01-05"。itemstr預設'return_ratio'決定板塊顏色深淺的指標。 除了可選擇依照 start 與 end 計算的
"return_ratio"(報酬率), 亦可選擇FinLab資料庫內的指標顯示近一期資料。 example:'price_earning_ratio:本益比'- 顯示近日產業的本益比高低。'monthly_revenue:去年同月增減(%)'- 顯示近月的單月營收年增率。
cliptuple將item邊界外的值分配給邊界值,防止資料上限值過大或過小,造成顏色深淺變化不明顯。 ex:(0,100),將數值低高界線,設為0~100,超過的數值。
Note
參考pandas文件更了解
pd.clip細節。
回傳
pd.DataFrame台股個股指標
比較多檔股票的財務指標
plot_tw_stock_radar() 把每個指標在全部股票中的排名切成 cut_bins 個等級,畫成雷達圖比較;數值是空值的股票不顯示等級。feats 不指定時用 18 項台股財務指標,軸的名稱是資料集名稱 : 後面那段。
from finlab.plot import plot_tw_stock_radar

# 範例 1:對比三檔股票的獲利能力
plot_tw_stock_radar(
    portfolio=['2330', '2454', '2317'],
    feats=[
        'fundamental_features:營業毛利率',
        'fundamental_features:營業利益率',
        'fundamental_features:稅後淨利率',
        'fundamental_features:ROE稅後',
    ],
    mode='bar_polar',  # 柱狀雷達圖
).show()

# 範例 2:分析單一股票的多維度指標
plot_tw_stock_radar(
    portfolio=['9939'],
    feats=[
        'fundamental_features:營業毛利率',
        'fundamental_features:營業利益率',
        'fundamental_features:稅後淨利率',
        'fundamental_features:現金流量比率',
        'fundamental_features:負債比率',
    ],
    mode='line_polar',  # 線狀雷達圖
    cut_bins=8,  # 將指標值切分為 8 個等級
).show()
mode 怎麼選:
'bar_polar':柱狀雷達圖,適合 2 到 5 檔股票對比。'line_polar':線狀雷達圖,適合單一股票多指標展示;line_polar_fill='toself'會把線圍成封閉區塊。'scatter_polar':散點雷達圖,適合查看原始數據點。
所有股票都沒有資料時回傳 None,並記錄錯誤訊息。
finlab.plot.plot_tw_stock_radar
plot_tw_stock_radar(portfolio, feats, mode, line_polar_fill, period, cut_bins, title, custom_data) -> go.Figure | None繪製台股雷達圖
比較持股組合的指標分級特性。若數值為nan,則不顯示分級。
參數
portfoliolist持股組合,ex:
['1101','1102']。featslist選定FinLab資料庫內的指標組成資料集。預設為18項財務指標。 ex:['fundamental_features:營業毛利率','fundamental_features:營業利益率']
modestr預設'line_polar'雷達圖模式 ,ex:'bar_polar','scatter_polar','line_polar'`。
Note
參考不同模式的差異
line_polar_fillstr將區域設置為用純色填充 。ex:
None,'toself','tonext''toself'將跡線的端點(或跡線的每一段,如果它有間隙)連接成一個封閉的形狀。 如果一條完全包圍另一條(例如連續的等高線),則'tonext'填充兩條跡線之間的空間,如果之前沒有跡線, 則其行為類似於'toself'。如果一條跡線不包含另一條跡線,則不應使用'tonext'。 欲使用 line_polar,請將pandas版本降至 1.4.4。Note
periodstr選擇第幾期的特徵資料,預設為近一季。 ex: 設定數值為'2020-Q2,取得2020年第二季資料比較。
cut_binsint預設10特徵分級級距。
titlestr圖片標題名稱。
custom_datapd.DataFrame客製化指標分級,欄名為特徵 格式範例:
stock_id 營業毛利率 營業利益率 稅後淨利率 1101 2 5 3 1102 1 8 4
回傳
plotly.graph_objects.Figure雷達圖
範例
ex1:比較持股組合累計分數,看持股組合偏重哪像特徵。
from finlab.plot import plot_tw_stock_radar
plot_tw_stock_radar(portfolio=["1101", "2330", "8942", "6263"], mode="bar_polar", line_polar_fill='None')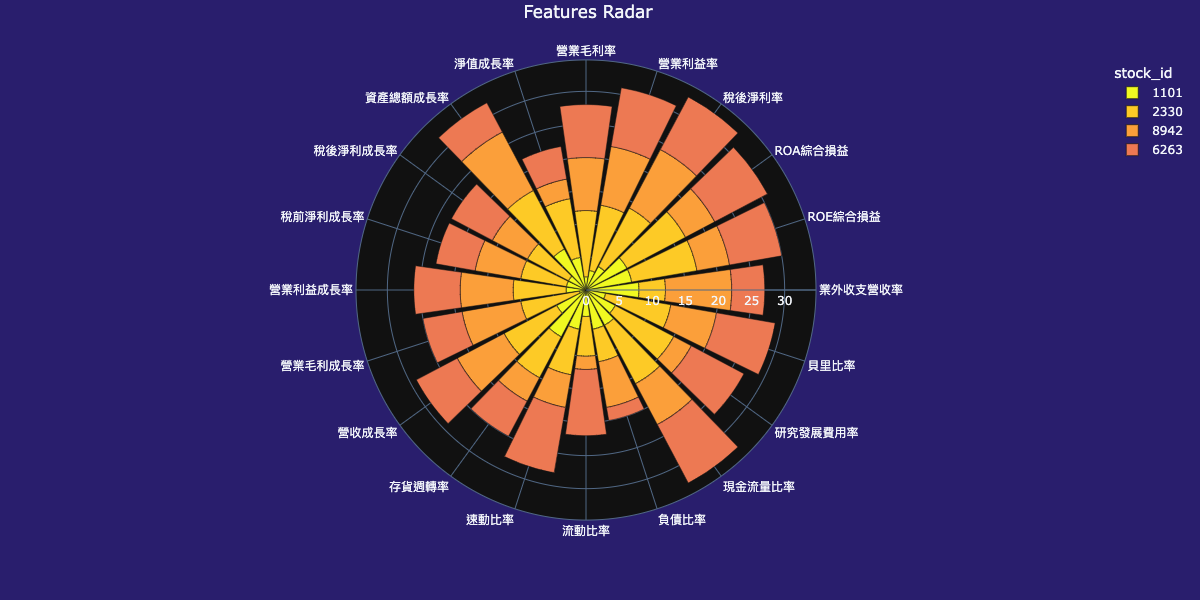 ex2:看單一個股特徵分級落點。
from finlab.plot import plot_tw_stock_radar
feats = ['fundamental_features:營業毛利率', 'fundamental_features:營業利益率', 'fundamental_features:稅後淨利率',
         'fundamental_features:現金流量比率', 'fundamental_features:負債比率']
plot_tw_stock_radar(portfolio=["9939"], feats=feats, mode="line_polar", line_polar_fill='toself', cut_bins=8)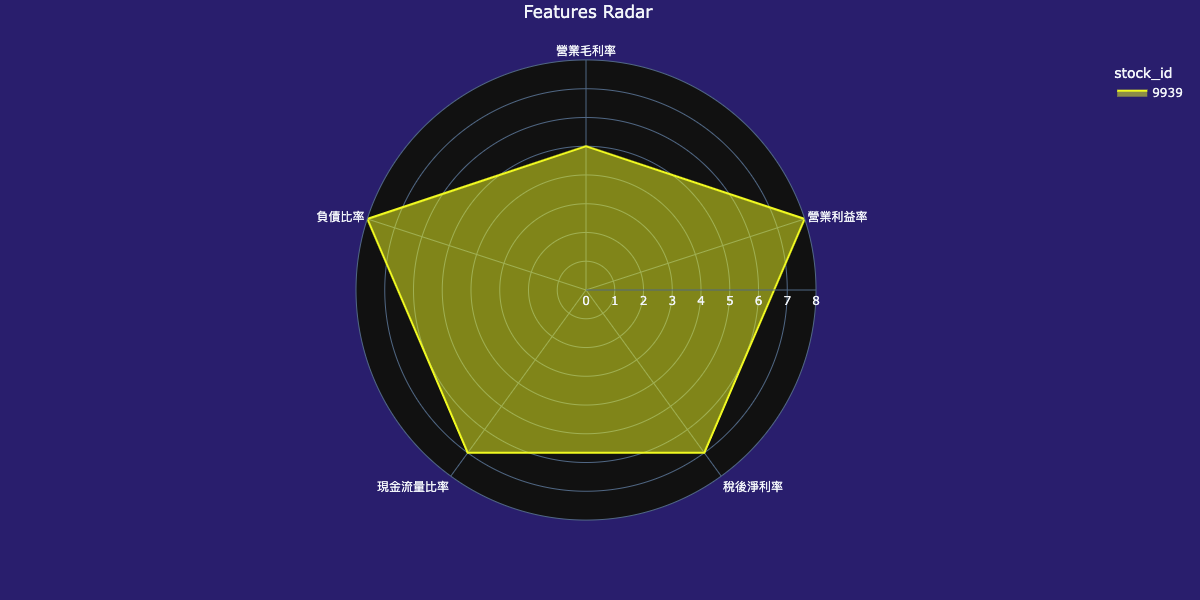
看估值位階的河流圖
plot_tw_stock_river() 取一檔台股在期間內本益比(或股價淨值比)的最低到最高值,等距切成幾個倍數,畫出各倍數對應的股價帶,再疊上收盤價,看目前的估值落在哪一層:
from finlab.plot import plot_tw_stock_river

# 範例 1:觀察台積電的本益比河流圖
plot_tw_stock_river(
    stock_id='2330',
    start='2015-01-01',
    end='2024-01-01',
    mode='pe',  # 本益比模式
    split_range=10,  # 將本益比分為 10 個區間
).show()

# 範例 2:觀察股價淨值比河流圖
plot_tw_stock_river(
    stock_id='2330',
    start='2015-01-01',
    end='2024-01-01',
    mode='pb',  # 股價淨值比模式
    split_range=8,
).show()mode='pe'是本益比河流圖(Price-to-Earnings Ratio),'pb'是股價淨值比河流圖(Price-to-Book Ratio)。split_range越大,顏色分級越細。symbol的預設值只是範例代號,請傳入你要看的股票。mode或股票代號不正確時回傳None。- 需要足夠長的歷史資料,建議至少 2 年;財報資料有延遲,最新一季可能還沒有數據。
finlab.plot.plot_tw_stock_river
plot_tw_stock_river(symbol, start, end, mode, split_range) -> go.Figure | None繪製台股河流圖
使用 PE or PB 的最高與最低值繪製河流圖,判斷指標所處位階。
參數
symbolstr預設'2330'台股股號,ex:
'2330'。startstr資料開始日,ex:
'2020-01-02'。endstr資料結束日,ex:
'2022-01-05'。modestr預設'pe''pe'or'pb'(本益比或股價淨值比)。split_rangeint預設8河流階層數。
回傳
plotly.graph_objects.Figure河流圖
範例
from finlab.plot import plot_tw_stock_river
plot_tw_stock_river(symbol='2330', start='2015-1-1', end='2022-7-1', mode='pe', split_range=10)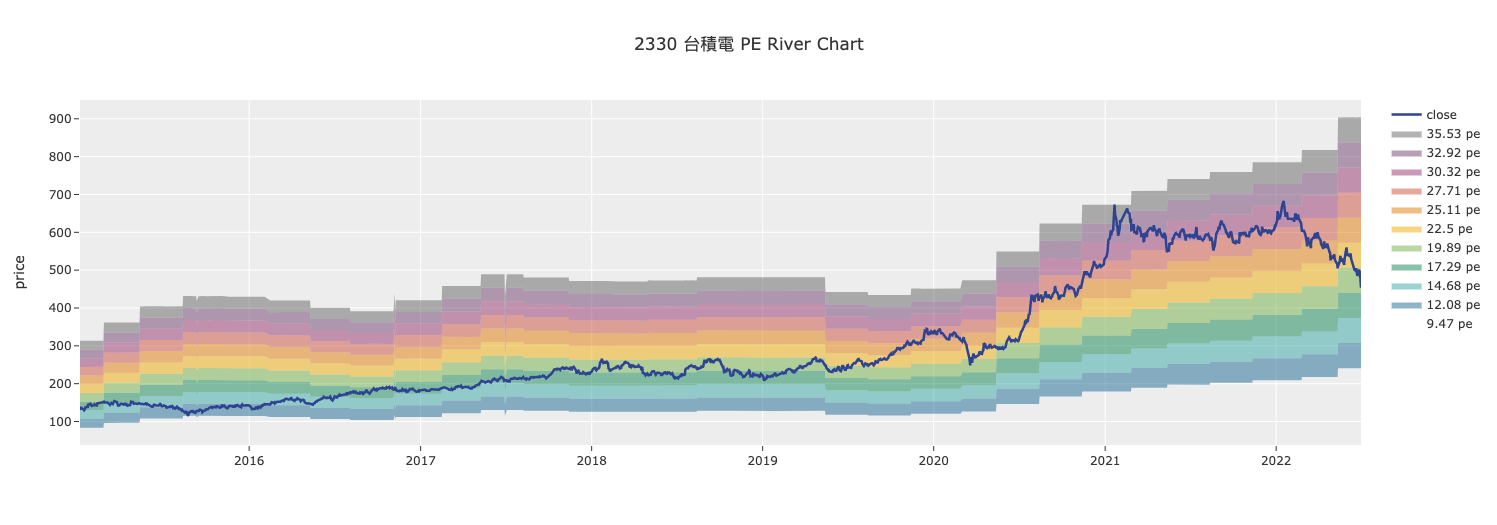
看雲端策略的持股與報酬
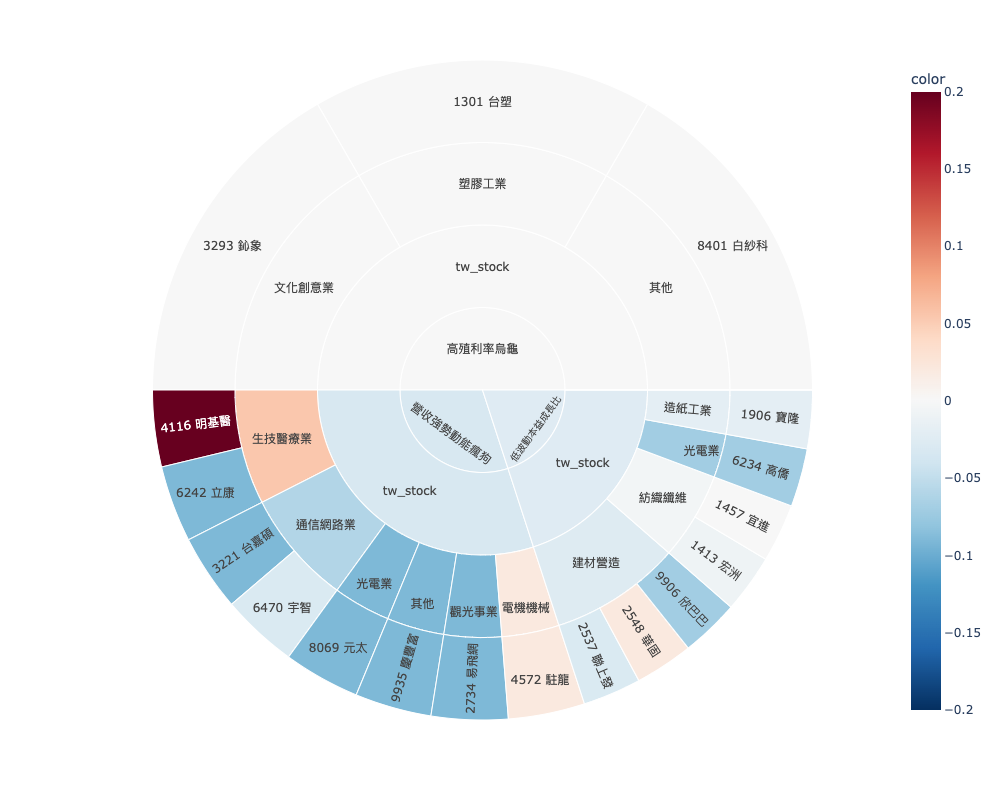
StrategySunburst 把各策略的持股依產業類別畫成旭日圖,一次監控多個策略:
from finlab.plot import StrategySunburst

# 實例化並繪製策略持倉分布
strategies = StrategySunburst()
strategies.plot().show()

# 看每檔持股被哪些策略選到
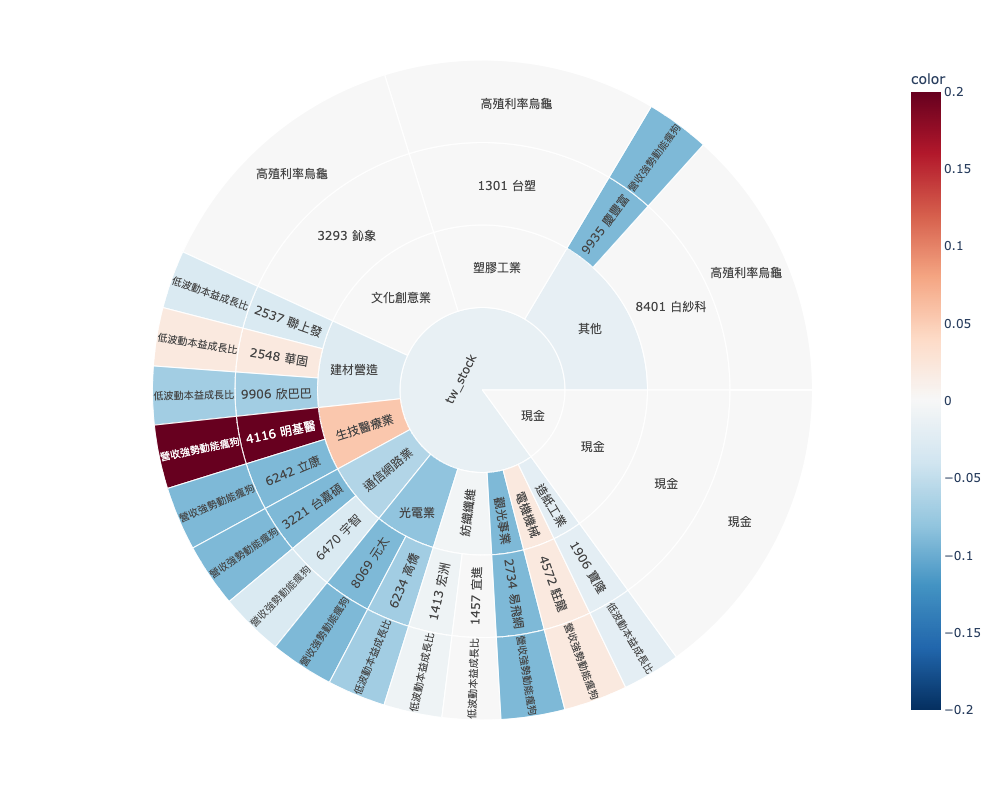
strategies.plot(path=['market', 'category', 'stock_id', 's_name']).show()
select_strategy 可以挑策略並設定資金權重,例如 {'策略 A': 0.6, '策略 B': 0.4};不指定時取全部策略、平分資金。get_strategy_df() 回傳套用權重後的合併持股,沒有任何策略時回傳 None。持股依台股產業分類,其他市場的持股都歸到 other_securities,所以不適合美股策略。
finlab.plot.StrategySunburst
StrategySunburst()繪製策略部位旭日圖
監控多策略。
方法與屬性
get_strategy_df
get_strategy_df
get_strategy_df(select_strategy) -> pd.DataFrame | None獲取策略部位與分配權重後計算的資料
參數
select_strategydict選擇策略名稱並設定權重,預設是抓取權策略並平分資金比例到各策略。 ex:
{'低波動本益成長比':0.5,'研發魔人':0.2, '現金':0.2}
回傳
pd.DataFramestrategies data
plot
plot
plot(select_strategy, path, color_continuous_scale) -> go.Figure | None繪圖
ex1:策略選到哪些標的?
ex2:部位被哪些策略選到,標的若被不同策略選到,可能有獨特之處喔!
參數
select_strategydict選擇策略名稱並設定權重,預設是抓取權策略並平分資金比例到各策略。 ex:
{'低波動本益成長比':0.5,'研發魔人':0.2, '現金':0.2}pathlist旭日圖由裡到外的顯示路徑,預設為
['s_name', 'market', 'category', 'stock_id']。['market', 'category','stock_id','s_name']也是常用選項。color_continuous_scalestr預設'RdBu_r'
回傳
plotly.graph_objects.Figure策略部位旭日圖
範例
from finlab.plot import StrategySunburst

# 實例化物件
strategies = StrategySunburst()
strategies.plot().show()
strategies.plot(select_strategy={'高殖利率烏龜':0.4,'營收強勢動能瘋狗':0.25,'低波動本益成長比':0.2,'現金':0.15},path =  ['market', 'category','stock_id','s_name']).show()
StrategyReturnStats 比較一段期間內各策略與大盤的報酬,大盤預設為台股加權報酬指數,可用 benchmark_return 換成其他價格序列:
from finlab.plot import StrategyReturnStats

# 比較期間內各策略與大盤(預設為台股加權報酬指數)的報酬
stats = StrategyReturnStats('2025-01-01', '2025-12-31')
stats.plot_strategy_last_return().show()  # 各策略期間報酬長條圖
stats.plot_strategy_creturn().show()  # 各策略累積報酬
plot_strategy_last_return() 畫各策略期間報酬的橫條圖,並標出大盤與策略平均;plot_strategy_creturn() 畫各策略與大盤的累積報酬。strategy_names 不指定時納入全部已上傳的策略,只能填你自己的策略。
finlab.plot.StrategyReturnStats
StrategyReturnStats(start_date, end_date, strategy_names, benchmark_return)繪製策略報酬率統計比較圖
監控策略群體相對對標指數的表現。
Examples
統計2022-12-31~2023-07-31的報酬率數據
# 回測起始時間
start_date = '2022-12-31'
end_date  = '2023-07-31'

# 選定策略範圍
strategy_names = ['膽小貓','三頻率RSI策略', '二次創高股票', '低波動本益成長比', '合約負債建築工', '多產業價投', '小蝦米跟大鯨魚', '小資族資優生策略', '本益成長比', '營收股價雙渦輪', '現金流價值成長', '研發魔人', '股價淨值比策略', '藏獒', '高殖利率烏龜','監獄兔', '財報指標20大']

report = StrategyReturnStats(start_date ,end_date, strategy_names)
# 繪製策略報酬率近期報酬率長條圖
report.plot_strategy_last_return().show()
# 繪製策略累積報酬率時間序列
report.plot_strategy_creturn().show()
參數
start_datestr報酬率計算開始日
end_datestr報酬率計算結束日
strategy_nameslist用戶本人的策略集設定,填入欲納入統計的策略名稱,只限定自己的策略。ex:
['膽小貓','三頻率RSI策略', '二次創高股票',...],預設為全部已上傳的策略。benchmark_returnpandas.Series策略比對基準序列,預設為台股加權報酬指數。
方法與屬性
get_benchmark_return
get_benchmark_return
get_benchmark_return() -> pd.Series設定對標指數
回傳
pandas.Series對標指數時間序列
plot_strategy_last_return
plot_strategy_last_return
plot_strategy_last_return() -> go.Figure繪製策略報酬率近期報酬率長條圖
回傳
plotly.graph_objects.Figure圖表物件
go.Figure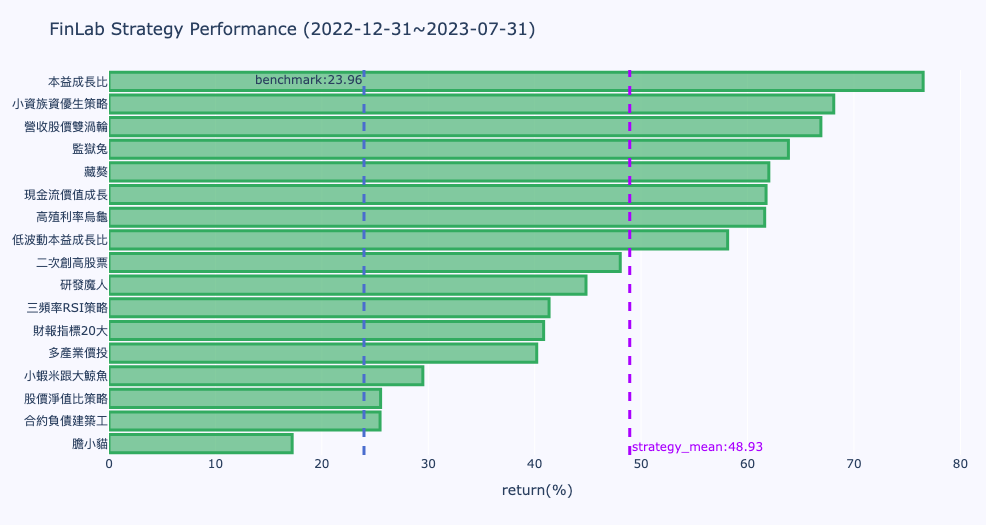
繪製策略報酬率近期報酬率長條圖
plot_strategy_creturn
plot_strategy_creturn
plot_strategy_creturn() -> go.Figure繪製策略累積報酬率時間序列
回傳
plotly.graph_objects.Figure圖表物件
go.Figure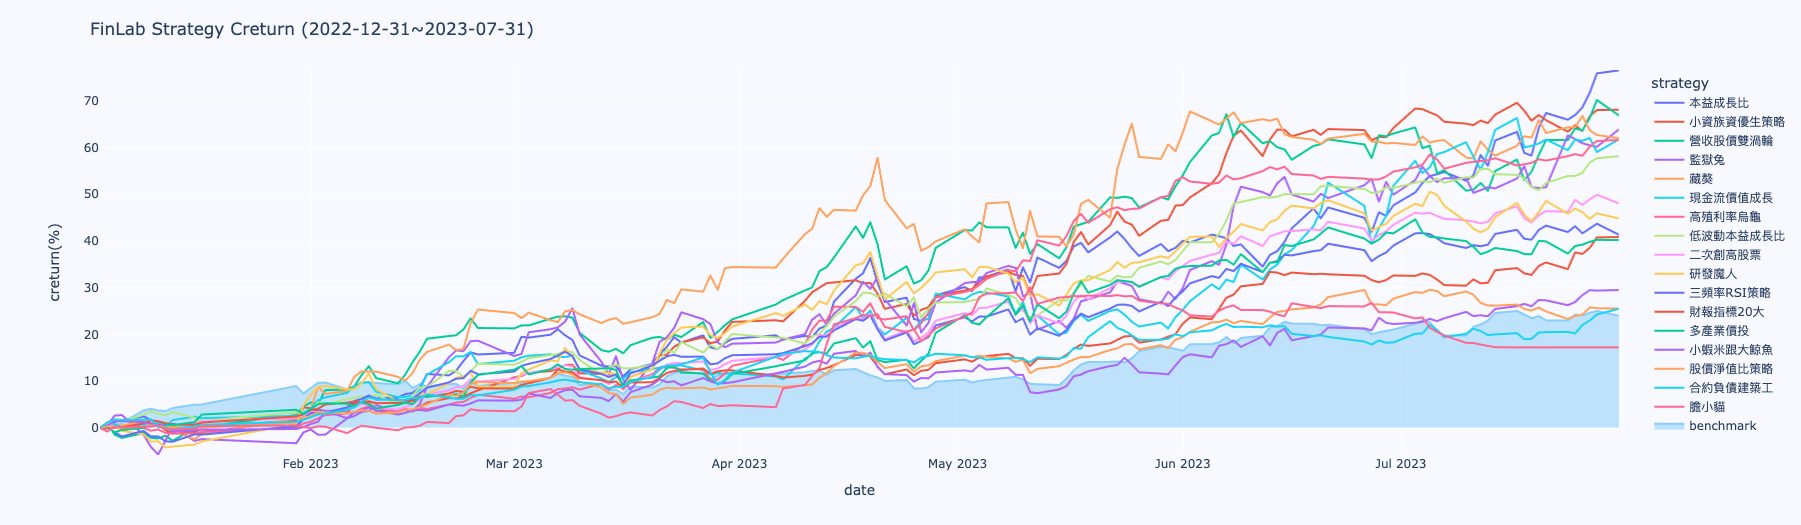
繪製策略累積報酬率時間序列
常見問題
圖表無法顯示怎麼辦?
from finlab.plot import plot_tw_stock_candles

# 原因 1:忘記呼叫 .show()
fig = plot_tw_stock_candles('2330')
# ❌ 沒有顯示

fig = plot_tw_stock_candles('2330')
fig.show()  # ✅ 正確

# 原因 2:缺少 plotly 套件
# 解決:pip install plotly

# 原因 3:Jupyter Notebook 環境問題
# 在 notebook 開頭加入:
import plotly.io as pio

pio.renderers.default = 'notebook'
如何匯出圖表為圖片?
from finlab.plot import plot_tw_stock_candles

fig = plot_tw_stock_candles('2330', recent_days=200)

# 匯出為 HTML(可互動)
fig.write_html('chart.html')

# 匯出為 PNG
fig.write_image('chart.png', width=1200, height=800)
匯出 PNG 需要安裝 Kaleido(pip install kaleido),它還需要電腦上有 Chrome 瀏覽器。
如何客製化圖表樣式?
from finlab.plot import plot_tw_stock_candles

fig = plot_tw_stock_candles('2330', recent_days=200)

# 修改標題
fig.update_layout(title='台積電股價走勢')

# 修改顏色主題
fig.update_layout(template='plotly_dark')  # 深色主題

# 調整圖表大小
fig.update_layout(width=1200, height=600)

fig.show()
板塊圖的 item 和雷達圖的 feats 可以用哪些欄位?
所有 data.get() 拿得到、每檔股票一個值的欄位都可以,常用的有:
'return_ratio':報酬率(只有板塊圖的item能用)'price_earning_ratio:本益比':本益比'price_earning_ratio:股價淨值比':股價淨值比'fundamental_features:營業毛利率':營業毛利率
from finlab import data

data.search('fundamental')  # 搜尋基本面欄位
雷達圖的指標數值差異很大怎麼辦?
雷達圖已經把數值換成排名等級,單位不同的指標(毛利率 0 到 100、負債比率可能到 300)也能放在一起比較。想調整等級的粗細,改 cut_bins:
from finlab.plot import plot_tw_stock_radar

plot_tw_stock_radar(
    portfolio=['2330', '2454'],
    feats=[
        'fundamental_features:營業毛利率',
        'fundamental_features:ROE稅後',
        'fundamental_features:負債比率',
    ],
    cut_bins=10,  # 將所有指標切分為 10 個等級
).show()
下一步
- 資料視覺化 每種圖的完整範例與實際畫出來的樣子。
- finlab.report 回測報告物件內建的績效圖表。
- 技術指標 用
data.indicator()算出要疊在 K 線上的指標。
進階的樣式調整可以查 Plotly 官方文件。
這一頁有幫到你嗎?