Guides
Strategy optimization
On this page9
How do you find the best combination of screening conditions? finlab.optimize.sim_conditions() backtests every combination and compares the results visually.
When developing trading strategies, you often have several screening conditions:
- Technical: moving average crossovers, new highs, RSI indicators
- Fundamental: P/E ratio, revenue growth, profitability
- Size and liquidity: market value, dollar volume
Each condition alone may produce mediocre performance, but combining several may yield unexpected results. Testing every combination by hand is extremely time-consuming; sim_conditions() automates it.
Backtest every combination at once
Put the conditions in a dictionary keyed by name and pass it to sim_conditions():
from finlab import data
from finlab.backtest import sim
from finlab.optimize.combinations import sim_conditions

data.set_market('us')
with data.us_universe(index='SP500'):
    close = data.get('price:adj_close')
    revenue = data.get('us_income_statement:revenue')  # Quarterly
    operating_income = data.get('us_income_statement:operating_income')  # Quarterly

# Define 3 conditions
c1 = (close > close.average(20)) & (close > close.average(60))  # Technical: MA breakout
c2 = operating_income.pct_change(4) > 0  # Fundamental: profit growth (year over year)
c3 = (
    revenue.pct_change(4) > 0.1
)  # Fundamental: revenue growth above 10% (year over year)

# Set exit condition
exits = close < close.average(20)

# Conditions dictionary, keys are condition names
conditions = {'c1': c1, 'c2': c2, 'c3': c3}

# Test all combinations
report_collection = sim_conditions(
    conditions=conditions,
    hold_until={'exit': exits, 'stop_loss': 0.1},  # Exit when below MA, 10% stop-loss
    resample='M',  # Monthly rebalancing
    position_limit=0.1,  # Max 10% per stock
    upload=False,  # Don't upload to cloud
)
hold_until takes the arguments of the entry/exit signal helper; every other argument (resample, position_limit, upload and so on) is passed to sim() as is.
This code automatically tests the following 7 combinations:
c1(technical only)c2(profit growth only)c3(revenue growth only)c1 & c2(technical + profit growth)c1 & c3(technical + revenue growth)c2 & c3(profit growth + revenue growth)c1 & c2 & c3(all three conditions)
Compare combinations with charts
The charts below are sample output from a five-condition run (c1 to c5); your figures depend on your conditions and data.
Cumulative return line chart
Compare the equity curves of each combination:
report_collection.plot_creturns().show()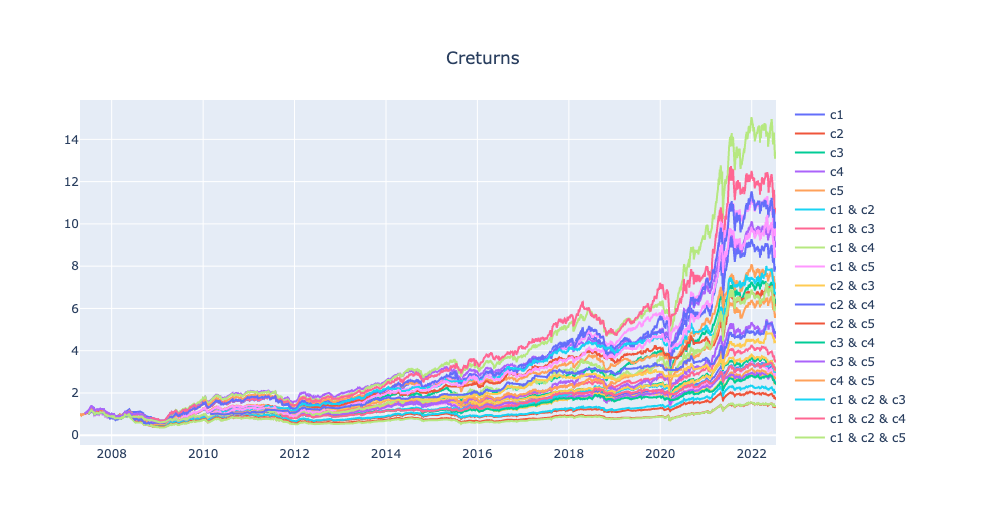
Grouped bar chart of metrics
report_collection.plot_stats('bar').show()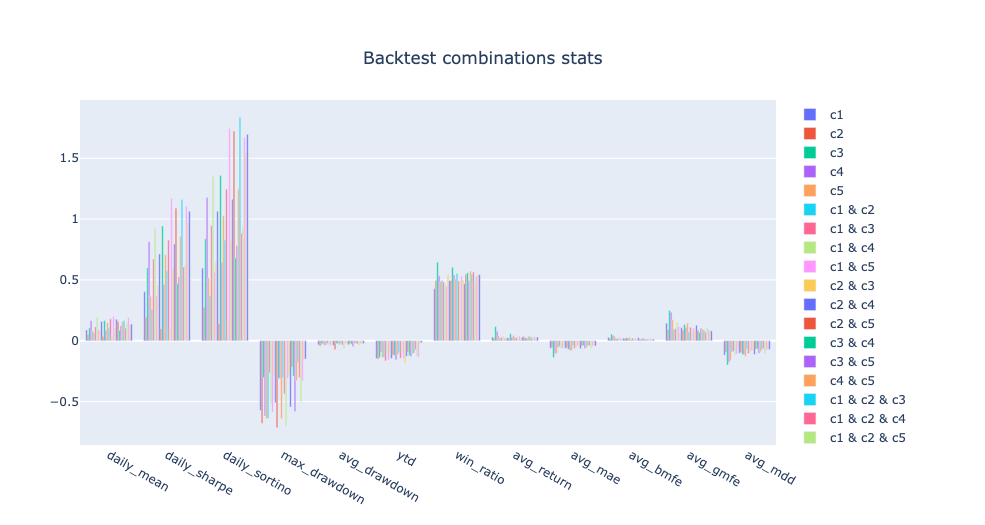
Metric ranking heatmap
The heatmap is returned as a styled table that displays directly in a notebook, without .show():
report_collection.plot_stats('heatmap')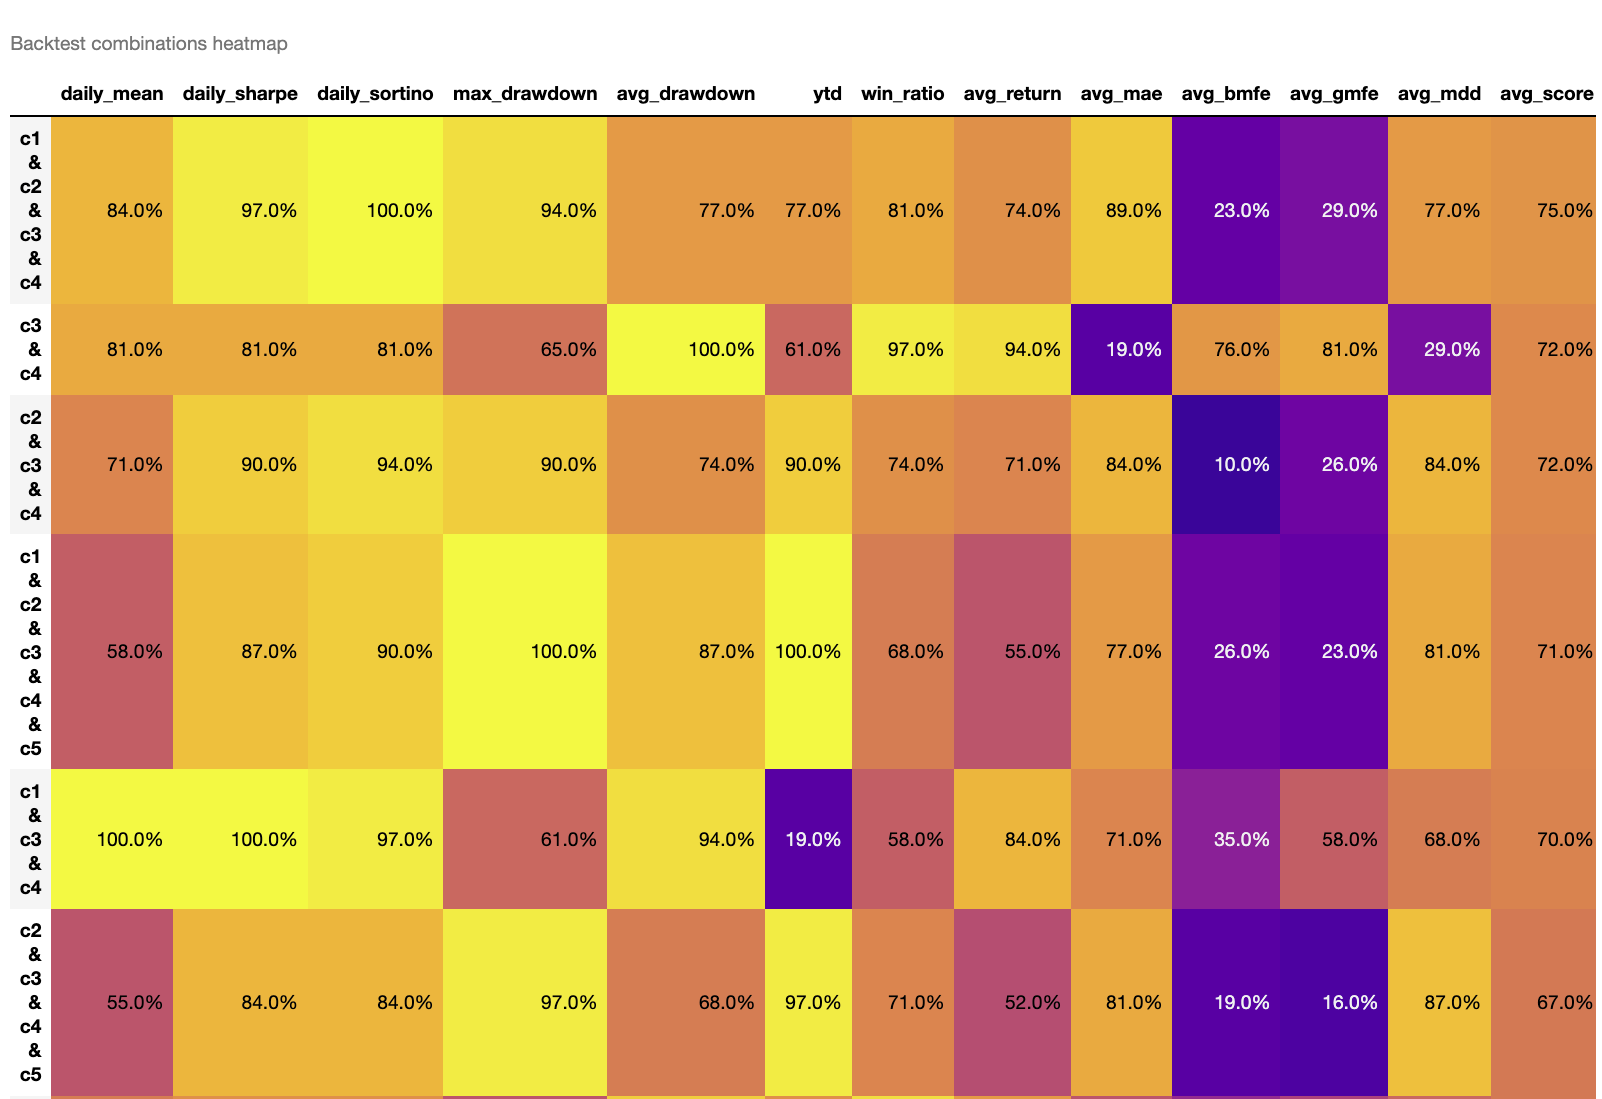
The heatmap uses color intensity to represent the percentile ranking (0-100%) of each metric. Higher values indicate better rankings:
- avg_score: average score across all metrics; higher scores indicate better overall performance
- Sorted by
avg_scorein descending order by default, with the best combination at the top - Brighter colors (yellow) indicate higher rankings for that metric
Show only some metrics or change the sort
indicators picks the metrics to show, and heatmap_sort_by picks the heatmap's sort column:
# Show only return, Sharpe ratio, and max drawdown
report_collection.plot_stats(
    'bar', indicators=['cagr', 'daily_sharpe', 'max_drawdown']
).show()

# Sort heatmap by Sharpe ratio
report_collection.plot_stats('heatmap', heatmap_sort_by='daily_sharpe')

# Sort heatmap by multiple metrics
report_collection.plot_stats('heatmap', heatmap_sort_by=['daily_sharpe', 'win_ratio'])
Get detailed performance metrics
stats = report_collection.get_stats()
print(stats)
Returns a DataFrame with 12 metrics:
Strategy-level metrics
| Metric | Description | Direction |
|---|---|---|
cagr | Annualized return (compound, CAGR) | Higher is better |
daily_sharpe | Annualized Sharpe ratio (risk-adjusted return) | Higher is better |
daily_sortino | Annualized Sortino ratio (downside risk-adjusted return) | Higher is better |
max_drawdown | Maximum drawdown (negative value) | Smaller absolute value is better |
avg_drawdown | Average drawdown (negative value) | Smaller absolute value is better |
ytd | Strategy return so far this year | Higher is better |
Trade-level metrics
| Metric | Description | Direction |
|---|---|---|
win_ratio | Win rate per trade | Higher is better |
avg_return | Average profit per trade | Higher is better |
avg_mae | Average MAE per trade (negative value) | Smaller absolute value is better |
avg_bmfe | Average BMFE (MFE before MAE) per trade | Higher is better |
avg_gmfe | Average global MFE per trade | Higher is better |
avg_mdd | Average max drawdown per trade (negative value) | Smaller absolute value is better |
Get one combination's backtest report
report_collection.reports is a dict keyed by combination name:
print(report_collection.reports.keys())
# Output: dict_keys(['c1', 'c2', 'c3', 'c1 & c2', 'c1 & c3', ...])

# Get a specific combination's report
report = report_collection.reports['c1 & c3']
report.display()
Advanced example: five conditions
Five conditions yield 31 combinations (2^5 - 1):
from finlab import data
from finlab.optimize.combinations import sim_conditions

data.set_market('us')
with data.us_universe(index='SP500'):
    close = data.get('price:adj_close')
    raw_close = data.get('price:close')  # unadjusted price for valuation
    eps = data.get('us_income_statement:eps_diluted')
    revenue = data.get('us_income_statement:revenue')

pe = raw_close / eps.rolling(4).sum()  # Trailing-12-month P/E
revenue_ma2 = revenue.average(2)
revenue_ma4 = revenue.average(4)

# 5 conditions
c1 = (close > close.average(20)) & (close > close.average(60))  # MA bullish alignment
c2 = close == close.rolling(20).max()  # 20-day new high
c3 = (pe > 0) & (pe < 15)  # Low P/E
c4 = (
    revenue_ma2 / revenue_ma4 > 1.05
)  # Revenue acceleration (last 2 vs. last 4 quarters)
c5 = revenue / revenue.shift(1) > 0.9  # Quarterly revenue change > -10%

exits = close < close.average(20)

conditions = {'c1': c1, 'c2': c2, 'c3': c3, 'c4': c4, 'c5': c5}

report_collection = sim_conditions(
    conditions=conditions,
    hold_until={'exit': exits, 'stop_loss': 0.1},
    resample='M',
    position_limit=0.1,
    upload=False,
)

# View heatmap to quickly find the best combination
report_collection.plot_stats('heatmap')
Suppose the heatmap shows c1 & c3 & c4 has the highest avg_score. Next:
- Check the cumulative return curve: confirm steady NAV growth
- Check key metrics:
- Sharpe ratio > 1.5? (Is risk-adjusted return sufficient?)
- Max drawdown < -30%? (Can you tolerate the worst case?)
- Win rate > 50%? (Is the trade win rate reasonable?)
- Analyze what the combination means:
c1 & c3 & c4represents "technical breakout + cheap valuation + revenue growth", a combination with clear business logic
Test stops at the same time
The hold_until parameter of sim_conditions() supports various exit logics:
# 1. Exit signal only
hold_until = {'exit': exits}

# 2. Exit signal + stop-loss
hold_until = {'exit': exits, 'stop_loss': 0.1}

# 3. Exit signal + take-profit
hold_until = {'exit': exits, 'take_profit': 0.2}

# 4. Exit signal + stop-loss + take-profit
hold_until = {'exit': exits, 'stop_loss': 0.1, 'take_profit': 0.2}

# 5. Exit signal + stop-loss (trailing stop requires trail_stop in sim())
hold_until = {'exit': exits, 'stop_loss': 0.1}
# Combined with: sim_conditions(..., trail_stop=0.15)A practical workflow
Define candidate conditions
Prepare 5 to 8 conditions.
Backtest each condition alone
Confirm each condition has basic performance.
Run sim_conditions()
Test all combinations.
Analyze the charts
- Use the heatmap to find the top 3 combinations
- Use the line chart to confirm NAV stability
- Use the bar chart to compare key metrics
Analyze the top 3 in detail
- Run MAE/MFE analysis
- Check liquidity (average dollar volume of the holdings)
- Run out-of-sample tests
Select the final strategy
Weigh performance, risk, and logical soundness.
FAQ
Too many combinations, and it takes too long?
With more than 6 conditions, there are more than 63 combinations. Suggestions:
- Pre-filter important conditions: use single-condition backtests to remove poorly performing conditions
- Test in batches: separate conditions into technical and fundamental groups
- Use a longer resample: switch to
resample='Q'(quarterly) to reduce computation
How do I avoid overfitting?
- Out-of-sample testing: optimize on historical data, validate on recent data
- Avoid too many conditions: be especially careful with more than 5 conditions
- Check combination logic: does the best combination have business logic behind it?
- Evaluate multiple metrics: don't just look at returns; also consider Sharpe ratio, drawdown, and win rate
What if conditions have different data frequencies?
FinLab aligns quarterly data to its SEC filing date and forward-fills automatically:
data.set_market('us')

# Daily data
close = data.get('price:adj_close')  # Updated daily

# Quarterly data, aligned to each SEC filing date
revenue = data.get('us_income_statement:revenue')
eps = data.get('us_income_statement:eps_diluted')

# Mixing frequencies works fine; FinLab auto forward-fills
conditions = {
    'c1': close > close.average(20),
    'c2': revenue.average(2) > revenue.average(4),
    'c3': eps > 0,
}
Why do some combinations fail to backtest?
Possible causes:
- Conditions too strict: no stocks meet the intersection criteria
- Missing data: some conditions have insufficient data coverage
- Insufficient memory: too many combinations cause OOM
Check the log for specific error messages.
Next steps
- Analysis modules Run MAE/MFE, period and alpha/beta analysis on the combination you pick.
- Backtesting Every
sim()parameter and the report. - Complete strategy workflow The full path from idea to live strategy.
- finlab.optimize Full parameters of
sim_conditions()andReportCollection.
Was this page helpful?